Correlative DF in CESM
One of the main functions in EW passive systems is DF (Direction Finding): being able to measure accurately the DOA of signals pertaining to surrounding transmitters is beneficial in terms of Tactical Picture Compilation and enables better targeting of EW countermeasures against enemy assets.
DF typically implies computing the DOA of signals by comparing how the same signal is measured differently by the antennas of a properly designed DF array; in principle the difference may pertain to different amplitude levels (or different relative phase), thus the existing DF techniques may be grouped in different categories (Amplitude DF, Phase interferometry, TDOA, Watson-Watt).
The choice of the most suitable DF technique depends heavily on the frequency band to be covered. For instance, amplitude DF may require directional antennas; directional patterns are difficult to obtain at low frequencies (e.g. VHF), so that Amplitude DF is not appealing in those frequency bands.
In VHF/UHF bands, one of the most used DF techniques for DF of communication and radar signals is the so-called “Correlative DF” ([Ref 1], [Ref 2], [Ref. 3]).
The “Correlative” technique is thus named because it is based on a comparison (“correlation”).
The comparison is done between the “features” of the received RF signals (one for each of the RF channels associated to the individual antennas which compose the DF array), and a data-set which completely describe how such features change for the DF array under analysis, as a function of:
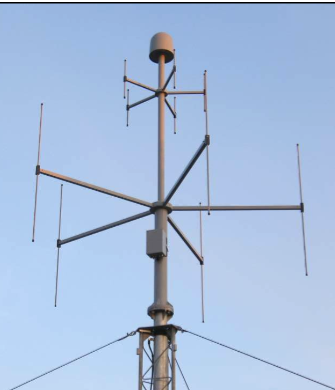
Figure 1: example of UCA
-
Frequency of the received RF signal
-
Angle of arrival; in particular always azimuth and (as a desired plus) elevation of the incoming RF signal
This data-set defines basically the <<array response>> w.r.t. variations of frequency and AOA.
A common choice for the DF array (when employing Correlative DF) is the UCA (Uniform Circular Array; UCA benefit from full azimuth coverage with uniform angular accuracy, and – when properly designed – guarantee frequency coverage of very wide frequency ranges with few antenna elements.
In the most basic form, the main “feature” measured is the phase difference between adjacent antennas of the UCA. However,
to exploit in the most effective way the DF array, the DF correlative technique takes into account not only the “phase difference” but also the “amplitude difference” ([Ref 5 ], [Ref 6]). That is also known as “mixed interferometric DF”.
Correlative DF (taking into account also amplitude) provides very large gain in performance and versatility w.r.t to different types of antenna pattern shapes, allowing for using diverse type of antennas to design very wideband DF arrays.
If one was to neglect non-idealities, as a matter of principle, the DOA could be computed just by solving analytical equations, as a function of the DF array diameter and other geometrical factors. That’s because geometry is all is needed to compute the theoretical variations of the “array response” as a function of DOA.
However, in real life non-idealities (e.g. mutual coupling between the elements of the array) may cause (and actually do) non-negligible deviations between the analytical array response and the “actual” array response ([Ref 7]). To overcome such problems, the “array response” is indeed measured on a representative item of the DF antenna in a measurement campaign ([Ref 8], [Ref 9]); this activity is known as “DF array calibration”, thus the data-set obtained after the measurement campaign is known as “calibration dataset”.
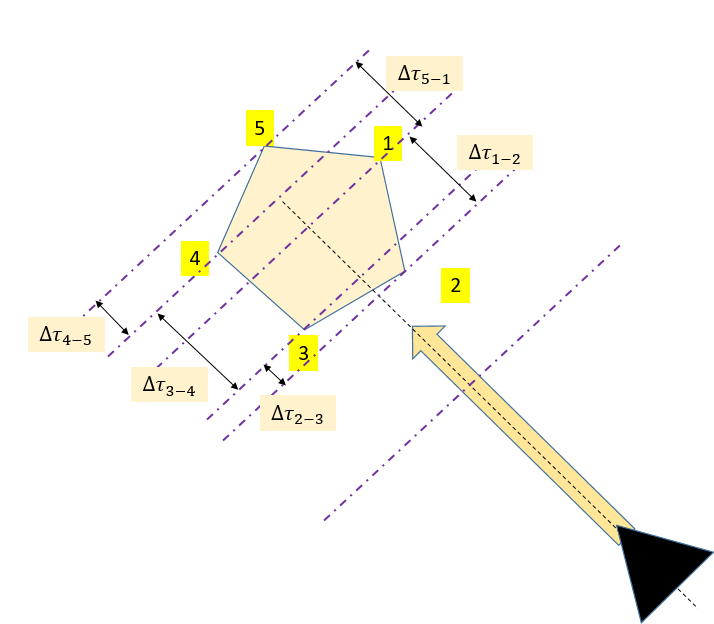
Figure 2: time/phase differences in mixed interferometric DF
The “DF array calibration” is performed just once, but it requires to be done in a RF test range with precise characteristics in terms of “spectral cleanliness” (i.e. far from strong RF interferers which could alter the measurements), lack of physical obstacles (which could cause scatterings, etc…) and distance between the DF array to be measured and the RF transmitting source.
During the DF array calibration a test signal is emitted varying the signal frequency by very small steps. For each frequency, the DF antenna is rotated by small steps in azimuth, allowing the collection of the dataset for each couple of frequency and AoA; the DF calibration measurements may be performed at multiple elevations
A DF software uses the “calibration dataset” to compute the AoA. In particular, two steps are envisaged:
-
First of all, the “differential phase” and “differential amplitude” are measured on the received RF signal; those data are then compared (“correlation”) with the “calibration data set” (at the frequency of the received RF signal); the “coarse” DOA estimate is the angle for which the correlation function is maximized.
-
In order to have a DOA estimate with a resolution finer than the one of the calibration data-set, an interpolation process (“manifold interpolation” [Ref 9]) is performed, elaborating the entries of the calibration data-set strictly adjacent to the one which gave the highest value of correlation
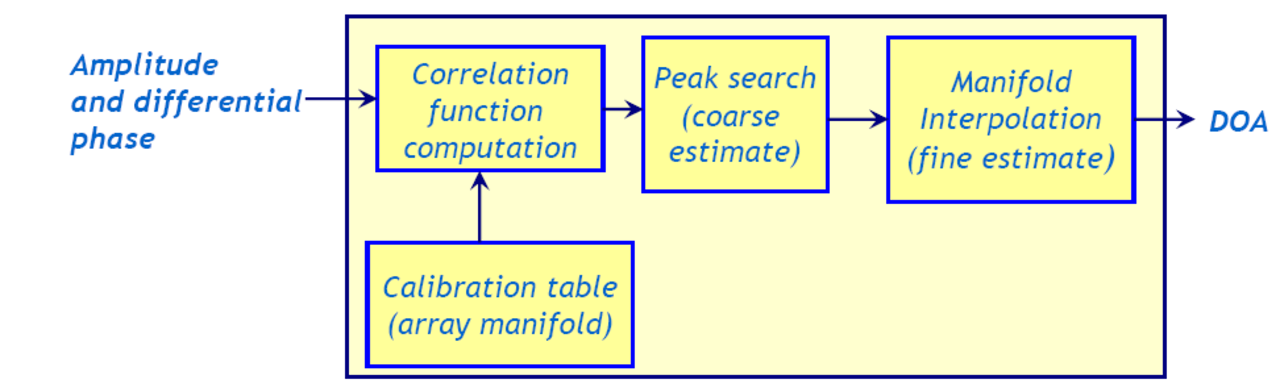
Figure 3: Correlative DF
Radar Electronic Countermeasures in Self-Protection Task
Amplitude Modulation in RECM Techniques
Signal Data Processing Deception